Here at ClientFlo we have the privilege of working with hundreds of clients across SEVERAL different industries. As a result, we have a wealth of data that can provide enhanced marketing insight when it comes to spend and performance metrics.
We decided to publish the data to the public.
What does “CPL” in “CPL Report” stand for or mean?
Well let me start of by stating that ClientFlo is a performance marketing agency. There are tons of digital marketing agencies out there that like to show off their creativeness or brag about awards they’ve won. At ClientFlo there is only 1 thing we care about: results for our clients.
CPL stands for Cost per Lead. It’s a simple metric that is derived from dividing total ad spend by the number of leads it produced. We believe that this metric is by far the most telling measure of how effective your marketing is. Thus, “The CPL Report”, stems from our agency’s DNA of being ultra performance-driven.
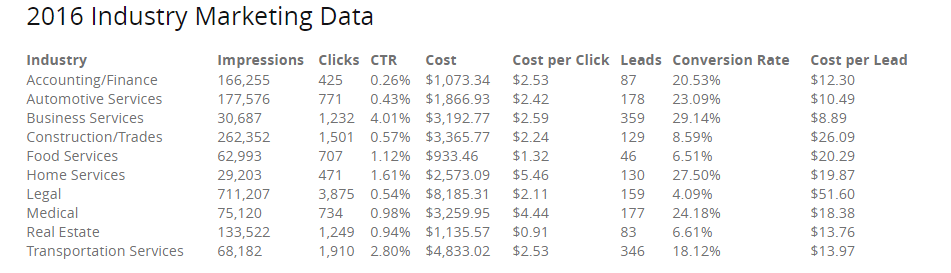
Please see below for the aforementioned data as well as an explanation for each metric. The data is based on performance over the 2016 calendar year, meaning the metrics seen below is what the average individual client in each of the stated industries experienced in 2016.
2016 Industry Marketing Data
| Industry | Impressions | Clicks | CTR | Cost | Cost per Click | Leads | Conversion Rate | Cost per Lead |
| Accounting/Finance | 166,255 | 425 | 0.26% | $1,073.34 | $2.53 | 87 | 20.53% | $12.30 |
| Automotive Services | 177,576 | 771 | 0.43% | $1,866.93 | $2.42 | 178 | 23.09% | $10.49 |
| Business Services | 30,687 | 1,232 | 4.01% | $3,192.77 | $2.59 | 359 | 29.14% | $8.89 |
| Construction/Trades | 262,352 | 1,501 | 0.57% | $3,365.77 | $2.24 | 129 | 8.59% | $26.09 |
| Food Services | 62,993 | 707 | 1.12% | $933.46 | $1.32 | 46 | 6.51% | $20.29 |
| Home Services | 29,203 | 471 | 1.61% | $2,573.09 | $5.46 | 130 | 27.50% | $19.87 |
| Legal | 711,207 | 3,875 | 0.54% | $8,185.31 | $2.11 | 159 | 4.09% | $51.60 |
| Medical | 75,120 | 734 | 0.98% | $3,259.95 | $4.44 | 177 | 24.18% | $18.38 |
| Real Estate | 133,522 | 1,249 | 0.94% | $1,135.57 | $0.91 | 83 | 6.61% | $13.76 |
| Transportation Services | 68,182 | 1,910 | 2.80% | $4,833.02 | $2.53 | 346 | 18.12% | $13.97 |
Impressions – The number of times the clients ad appeared on the internet. This could include search results page, display network or video play.
Clicks – The number of times a viewer actually clicked on the ad.
CTR (Clickthrough Rate) – The division of Clicks / Impressions, it’s a measure of how effective your ad copy or targeting is.
Cost – The total amount of ad spend the client has paid.
Cost per Click – The amount of ad spend paid every time someone clicks on a client’s ad.
Leads – The number of inquiries from new customers (phone & email) as a result of the marketing campaigns.
Conversion Rate – The division of Leads / Clicks, it’s a measure of how effective your landing page is. After someone clicks on a clients ad and lands on their page, how many of them are taking action?
Cost per Lead – The division of Cost / Leads, this holy grail of performance metrics. It details how much clients are paying for each new customer to contact their business and inquire about their service.
We are in the process of developing a regular series for “The CPL Report” where we will publish marketing data either monthly or quarterly along with insightful commentary and analysis for small business owners as well as fellow digital marketers.
Stay tuned…
Jay Vasantharajah